Introducing systing
Introducing systing
systing is the result of about 6 months of experimenting with different ways
to debug difficult to understand applications. I spend a lot of time debugging
in environments where I know nothing about the application, and a lot of the
tools we use for debugging are not very useful in answering the basic question
of “what is this application doing?” Like most kernel developers, I have a lot
of tools in my toolbox, perf, bpftrace, custom BPF tooling, drgn, etc.
These are all super powerful tools, but they’re mostly building block tools.
Tools I use when I already know what I’m looking for.
I spend far too much time looking at perf, running some basic bpftrace
scripts, and trying to reason about what could possibly be happening in the
application.
systing is an attempt to build a tool that can make me faster at debugging
things, and hopefully help you too. It generates a trace that you can load into
perfetto and visualize the whole system.
Wait, what’s perfetto?
systing is only half of the solution, the other half is perfetto. There’s
actually two parts to perfetto, the perfetto daemon, and the perfetto UI.
The UI is a web application that runs in your browser, and the daemon is an
application that runs on the host system and can collect all sorts of
information. If you’ve developed for Android you’ve probably used perfetto
before.
systing does the job of generating a trace file that can be uploaded into the
perfetto UI. This can be done a few different ways, but the easiest way is to
use their demo site. You can upload a trace file
and view it in the UI.
systing “replaces” the daemon part of perfetto. I say “replaces” because it
doesn’t really. The daemon is meant to run all the time (or on demand) and does
a pretty great job of giving you all the configuration necessary to get what you
want out of the system.
Uh, why reinvent the perfetto daemon wheel?
There’s a few reasons for this. First I want to be clear that perfetto is
completely capable of doing everything systing does and much more. I’m not
aiming to replace the use cases that the daemon provides. However there’s a few
things that systing accomplishes that make it compelling for the use case of
kernel developers.
- It is records everything you could want out of the box (if you’re a kernel
developer). With
perfettoyou have to configure the daemon to record what you want, and if you aren’t intimately familiar with the linux scheduler, you won’t know what events to configure.systingout of the box records all of scheduling events you need, records stack traces, and records all of the IRQ/SOFTIRQ events. - It’s a single binary. In order to just do a quick recording session with
perfettoyou have to build itsbusyboxfeature and then run it, which in certain constrained environments doesn’t work well (like my test VMs). - It uses BPF for (almost) everything.
perfettousesftraceto record all of its events. This is problematic in production if there are multiple users offtrace, and requires the user to know how to setup ftrace instances. Additionally I lost events constantly through this, which is a well known drawback offtracefor this particular use case. - I often am debugging tasks on very busy machines, so I want a quick way to
just profile things under a specific CGROUP, which isn’t something that’s
possible with
perfettoout of the box. The BPF CGROUP integration makes it easy to filter on things I care about. perfettowill not record stack traces on Linux. Apparently this exists for Android, but it won’t doperfstyle stack tracing.systingrecordsperfstyle stack traces, as well as stack traces onUNINTERRUPTIBLE SLEEPevents, to make it super easy to tell what an application is doing, and you get to take advantage of theperfettoUI’s built in flamegraphs.- Again,
perfettocan doftraceevents, so if you properly configure aUSDTor auprobethen you can capture this, but you need to know how to find/configure those things.systingdoes this for you in the same way thatbpftracedoes. This is always going to be a more advanced use case, but it’s much simpler withsysting.
Ok cool, how do I use it?
First you’ll need to clone the repo, and then build it with
cargo build --release
This will build the systing binary in target/release/systing. You can then
copy this to wherever you need to, or simply rung it from the target/release
directory
sudo ./target/release/systing --duration 10
The docs for the various options can be found
here,
including how to use USDT’s, uprobes, and perf events.
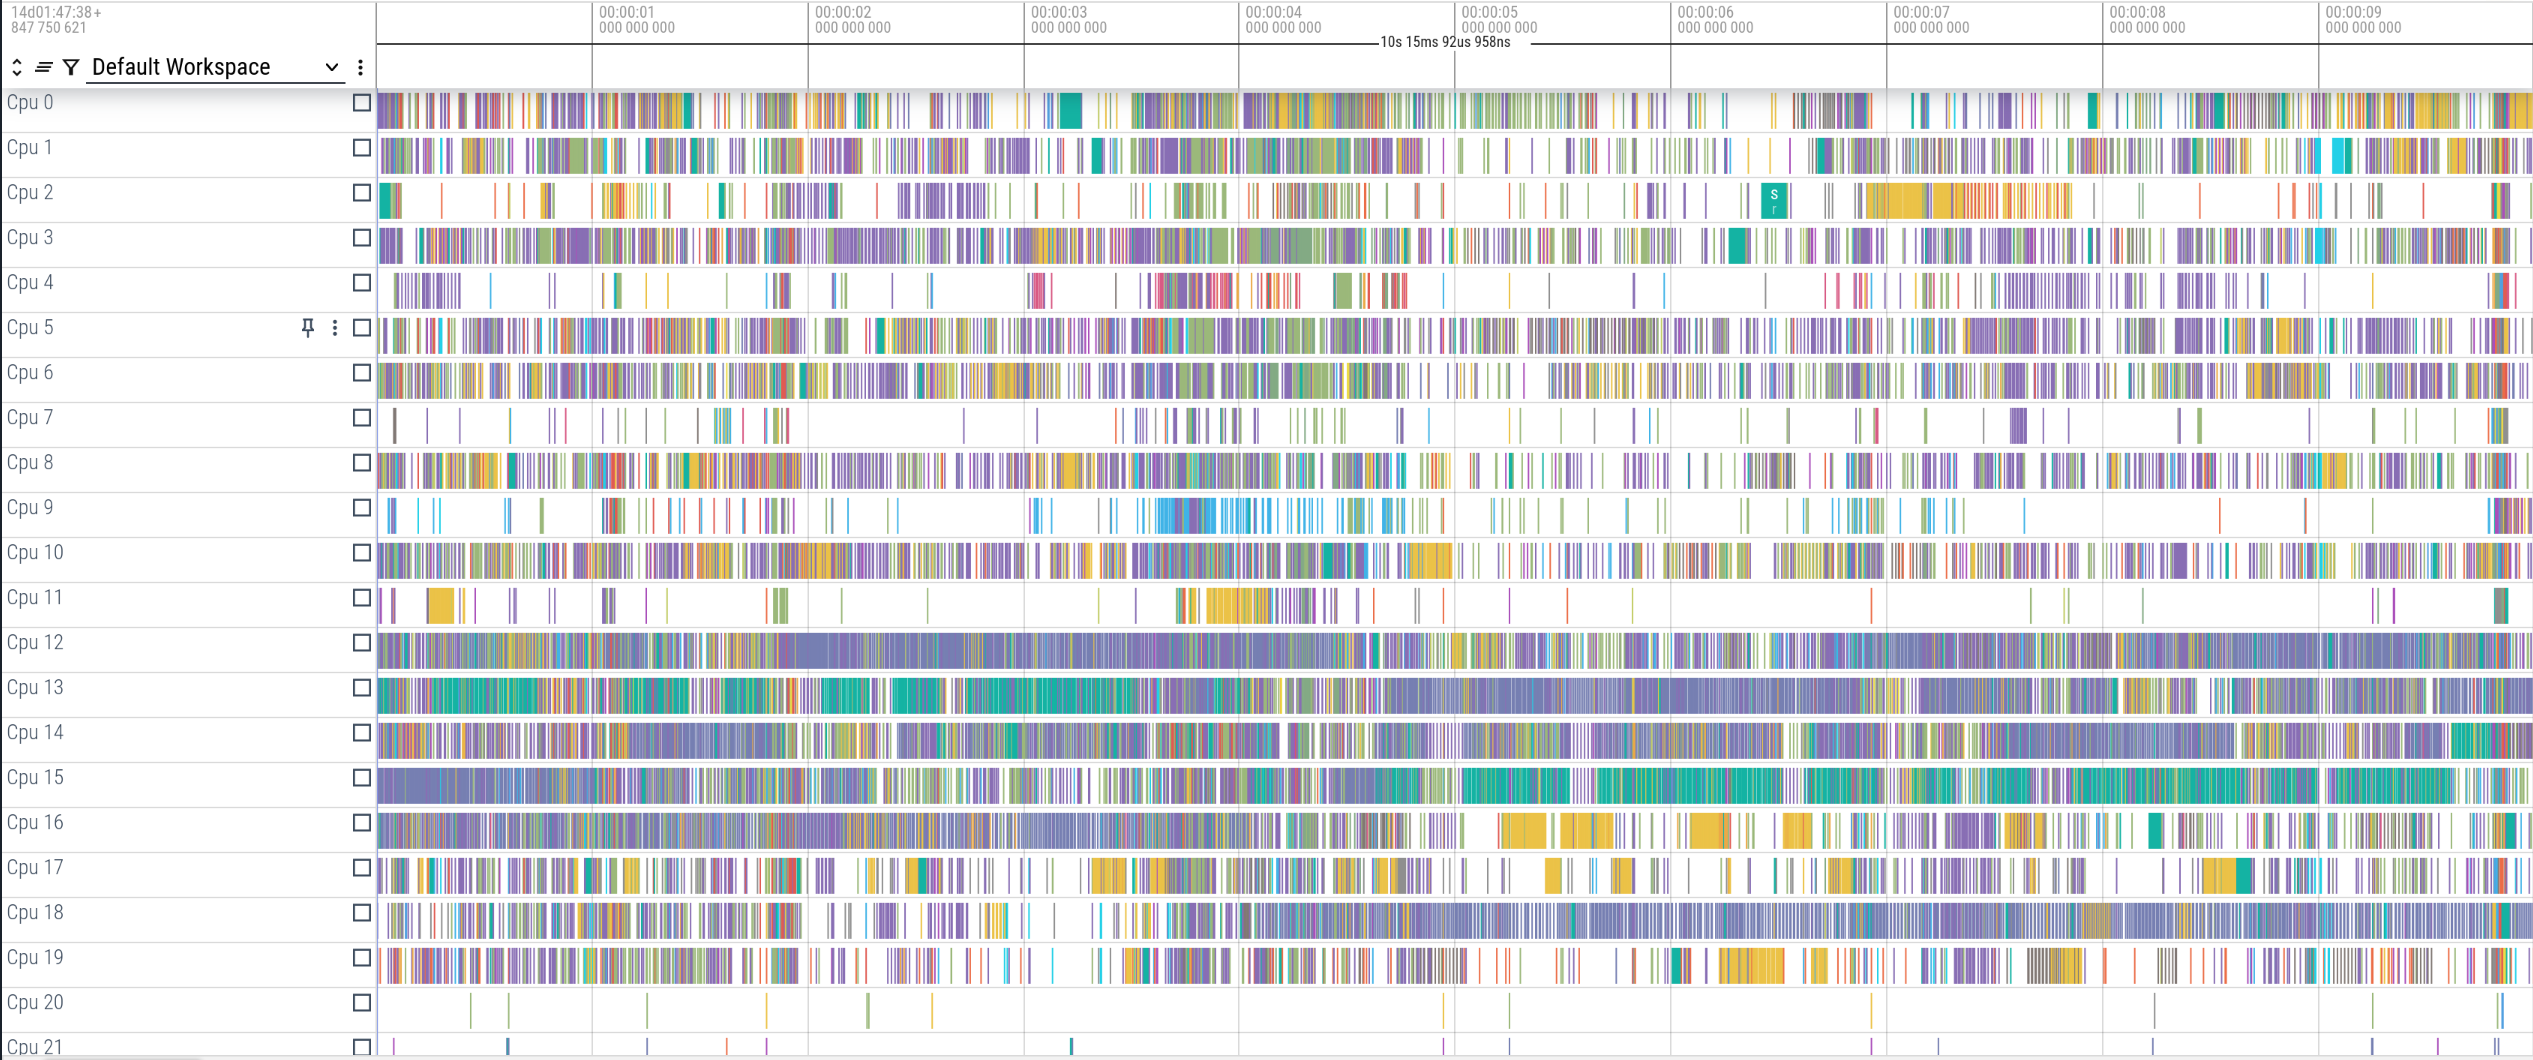
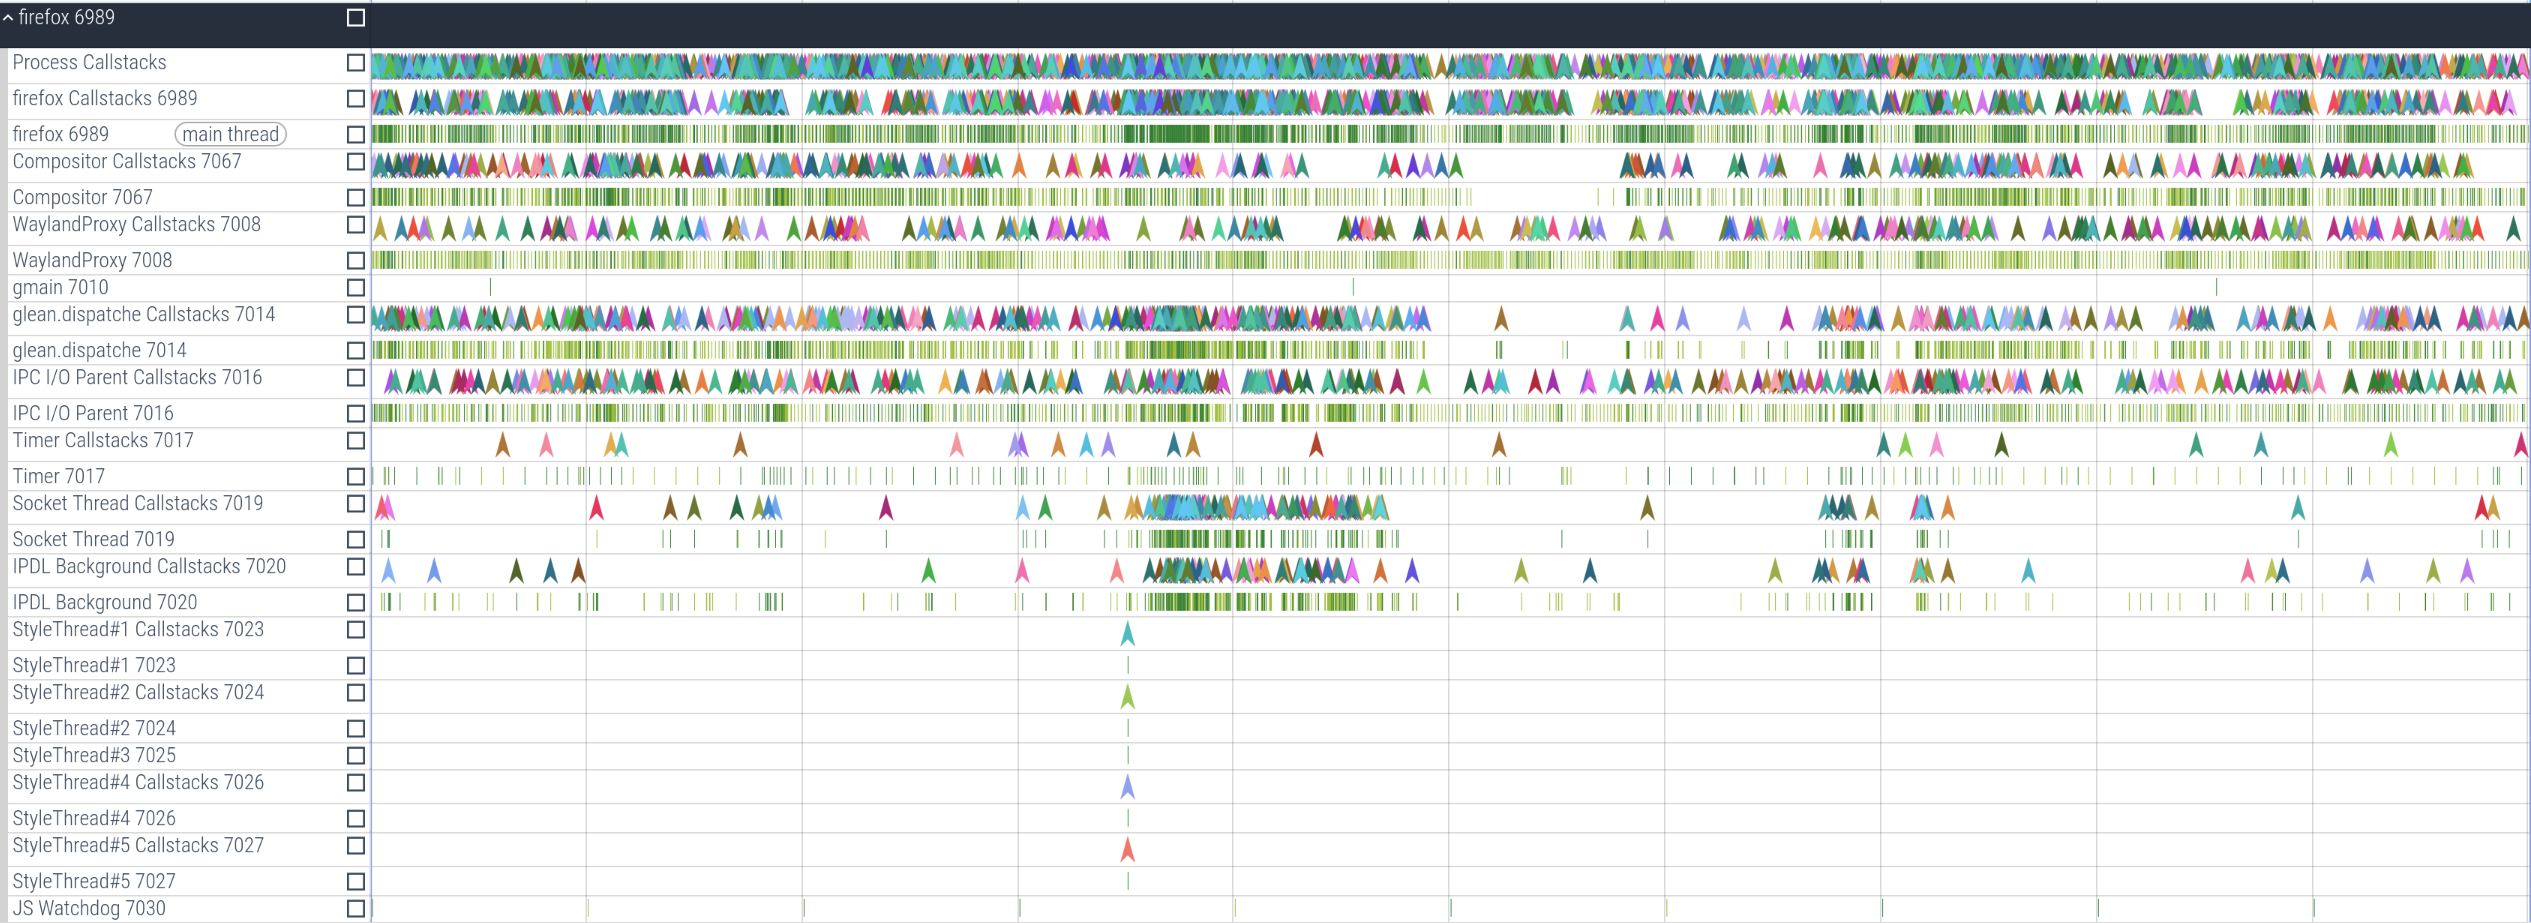
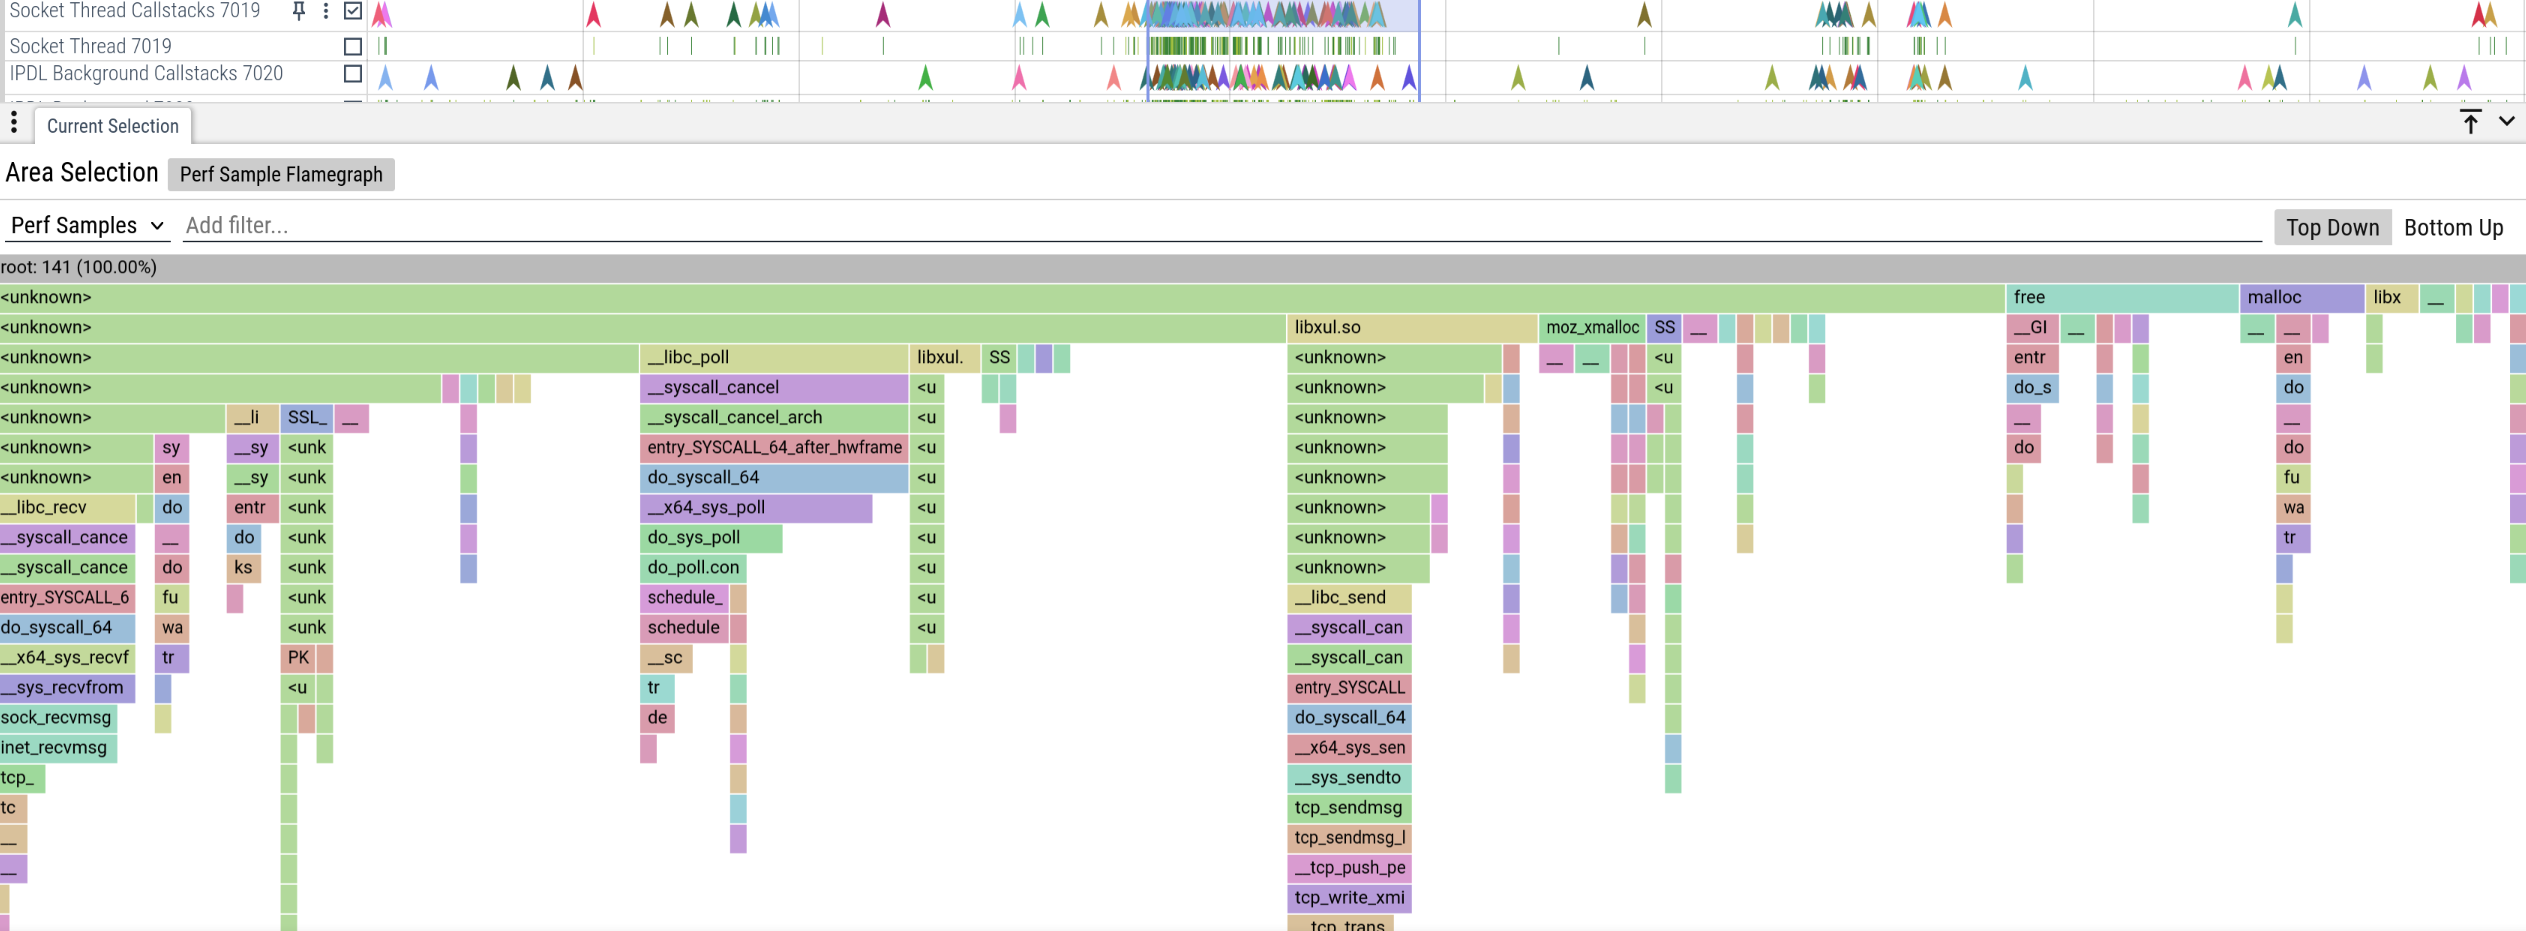
From there you can load the trace.pb file into a perfetto UI instance. I’ve
included a few screenshots of what this looks like below.


Future plans
I’m currently working on integrating python stacks support using strobelight
libs. This will give
us the ability to record python stacks in the same way that perf does, which
will be useful for any heavily python related application.
I’m also going to work on the ability to have user defined start and stop events
so we can create perfetto tracks with longer events to make it easier to view
certain behaviors. This will be a much more advanced usage, but I will likely
add some examples for common things like pthread mutexes.
As I debug more and more things I will likely add more and more features, but so far this tool has enabled a wide variety of debugging use cases and has pretty drastically sped up my entire process.